A-TEEM Spectroscopy

A-TEEM™ stands for simultaneous Absorbance, Transmission, and Fluorescence Excitation-Emission-Matrix (EEMs) Acquisition. It is a novel, robust, and extremely sensitive analytical technique.
HORIBA’s Fluorescence division incorporates technology from SPEX, IBH, Jobin-Yvon, PTI and SLM - the dominant names in Fluorescence Spectroscopy. We offer the widest range of Steady State Fluorescence spectrometers, Fluorescence Lifetime spectrometers, Steady State and Lifetime Multi instruments and Microscope-based Microscopy solutions.
Our broad lines of Fluorescence instrumentation extend from compact Fluorometers and Fluorescence Spectrometers to Modular Spectrofluorometer Systems. We can create an optimum solution for your needs and budgets with an extensive selection of components, software and accessories.
Many Nobel Laureates in various fields of science have used HORIBA fluorometers in their research. Some even used them in the body of research that resulted in their being awarded a Nobel Prize.
MoreHORIBA’s new A-TEEM Compliance Package provides solutions for record-keeping, method validation, and instrument verification to meet regulatory requirements.
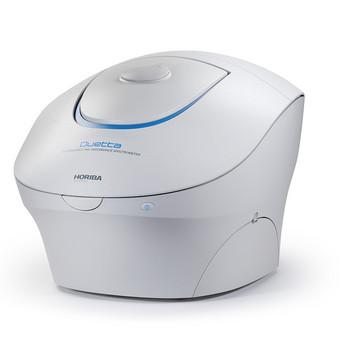
MoreThe Duetta™ spectrofluorometer is an optimal instrument for teaching fluorescence spectroscopy to undergraduate students. Here are five experiments that can be performed on the Duetta and give students valuable hands-on experience in fluorescence measurements. These experiments are excerpted from the book, Practical Fluorescence Spectroscopy, 1st Edition by Zygmunt (Karol), Gryczynski, Ignacy.
MoreAre you looking to enhance your proficiency in fluorescence spectroscopy and make the most out of your experiments? Look no further. Our comprehensive library of short, informative videos is designed to provide you with invaluable tips and tricks that will take your fluorescence spectroscopy skills to the next level.
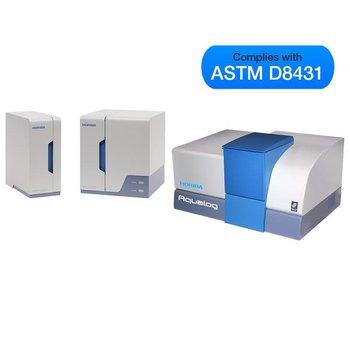
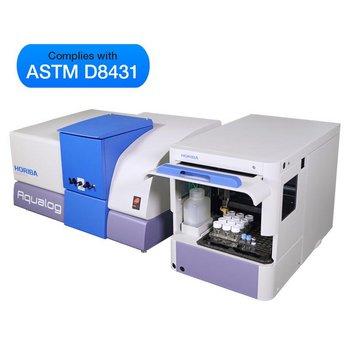
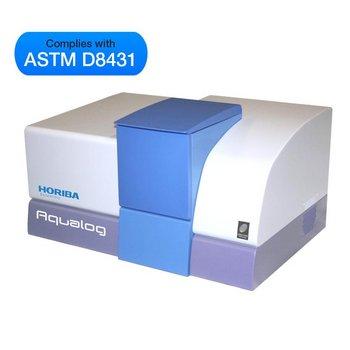
MoreThe HORIBA Aqualog® is a unique optical spectrometer that was initially invented to meet the needs of environmental water researchers around the world studying color dissolved organic matter (CDOM) using fluorescence spectroscopy. Today the Aqualog is the gold standard in CDOM water research, but it is also increasingly being applied with precision as a faster, less expensive and much easier analytical tool in industrial applications.
MoreTo help you understand the various choices of Fluorescence Systems and the Fluorescence Spectroscopy applications for them, HORIBA Scientific presents a number of Tutorials and instructional Webinars.
View WebinarsEzSpec Software is fast, efficient, and user friendly. The high quality graphics and intuitive design will delight students and professionals. See why EzSpec and Duetta are setting the standard for analytical instrumentation. For more info go to Duetta webpage.
Watch VideoListen to our interview on AZO Networks for insight into the current market of fluorometers and what makes Duetta different.
Read MoreFrom the global leaders in fluorescence comes a new bench-top instrument and a new concept for analytical molecular spectroscopy.
Watch Video
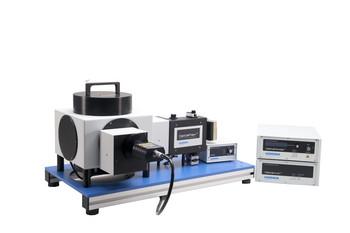
Modular Research Fluorometer for Lifetime and Steady State Measurements
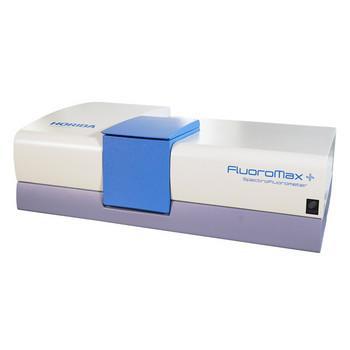
Fluorescence and Absorbance Spectrometer
Automated Organic Analysis & Early Warning Sentinel
A Simple, Fast, “Column Free” Molecular Fingerprinting Technology
The Gold Standard for Water CDOM Research
Steady State and Lifetime Benchtop Spectrofluorometer
TCSPC/MCS Fluorescence Lifetime System
TCSPC Lifetime Fluorometer
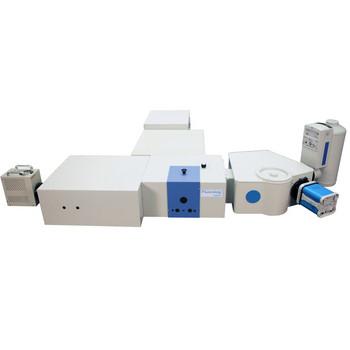
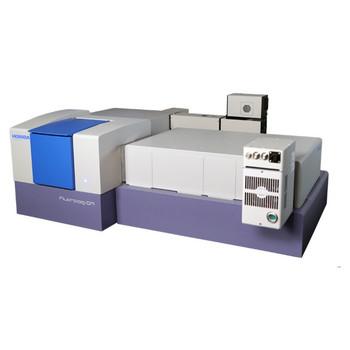
Steady State and Lifetime Nanotechnology EEM Spectrofluorometer

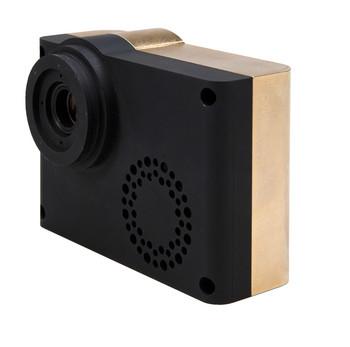
SPAD array imaging camera for dynamic FLIM studies at real time video rates
HORIBA’s latest development in TCSPC detector technology
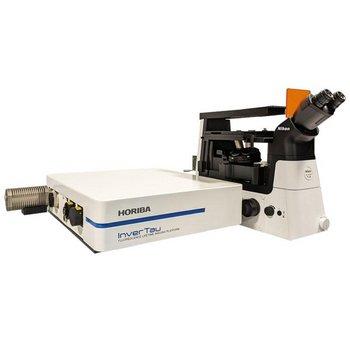
Fluorescence Lifetime Imaging Platform
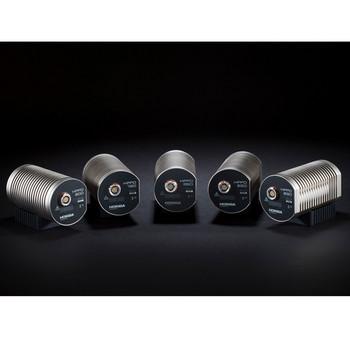
Single photons detection with picosecond accuracy
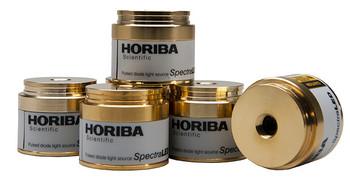
LED Phosphorescence Light Sources
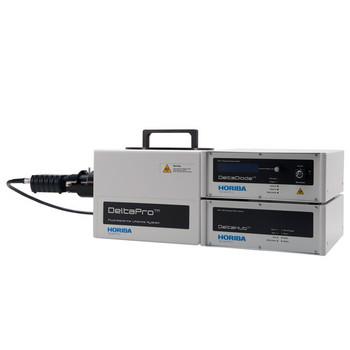
Ultra Fast TCSPC Lifetime Fluorometer
Do you have any questions or requests? Use this form to contact our specialists.